LIMITED FREE TRIAL
Test-drive StreetLight’s validated analytics on your desktop now
We help you measure transportation by providing powerful analytics accessible on your desktop through our StreetLight InSight® platform — in a matter of minutes. Explore StreetLight InSight® Go at no cost — equipped with a subset of our key StreetLight InSight® Metrics*.
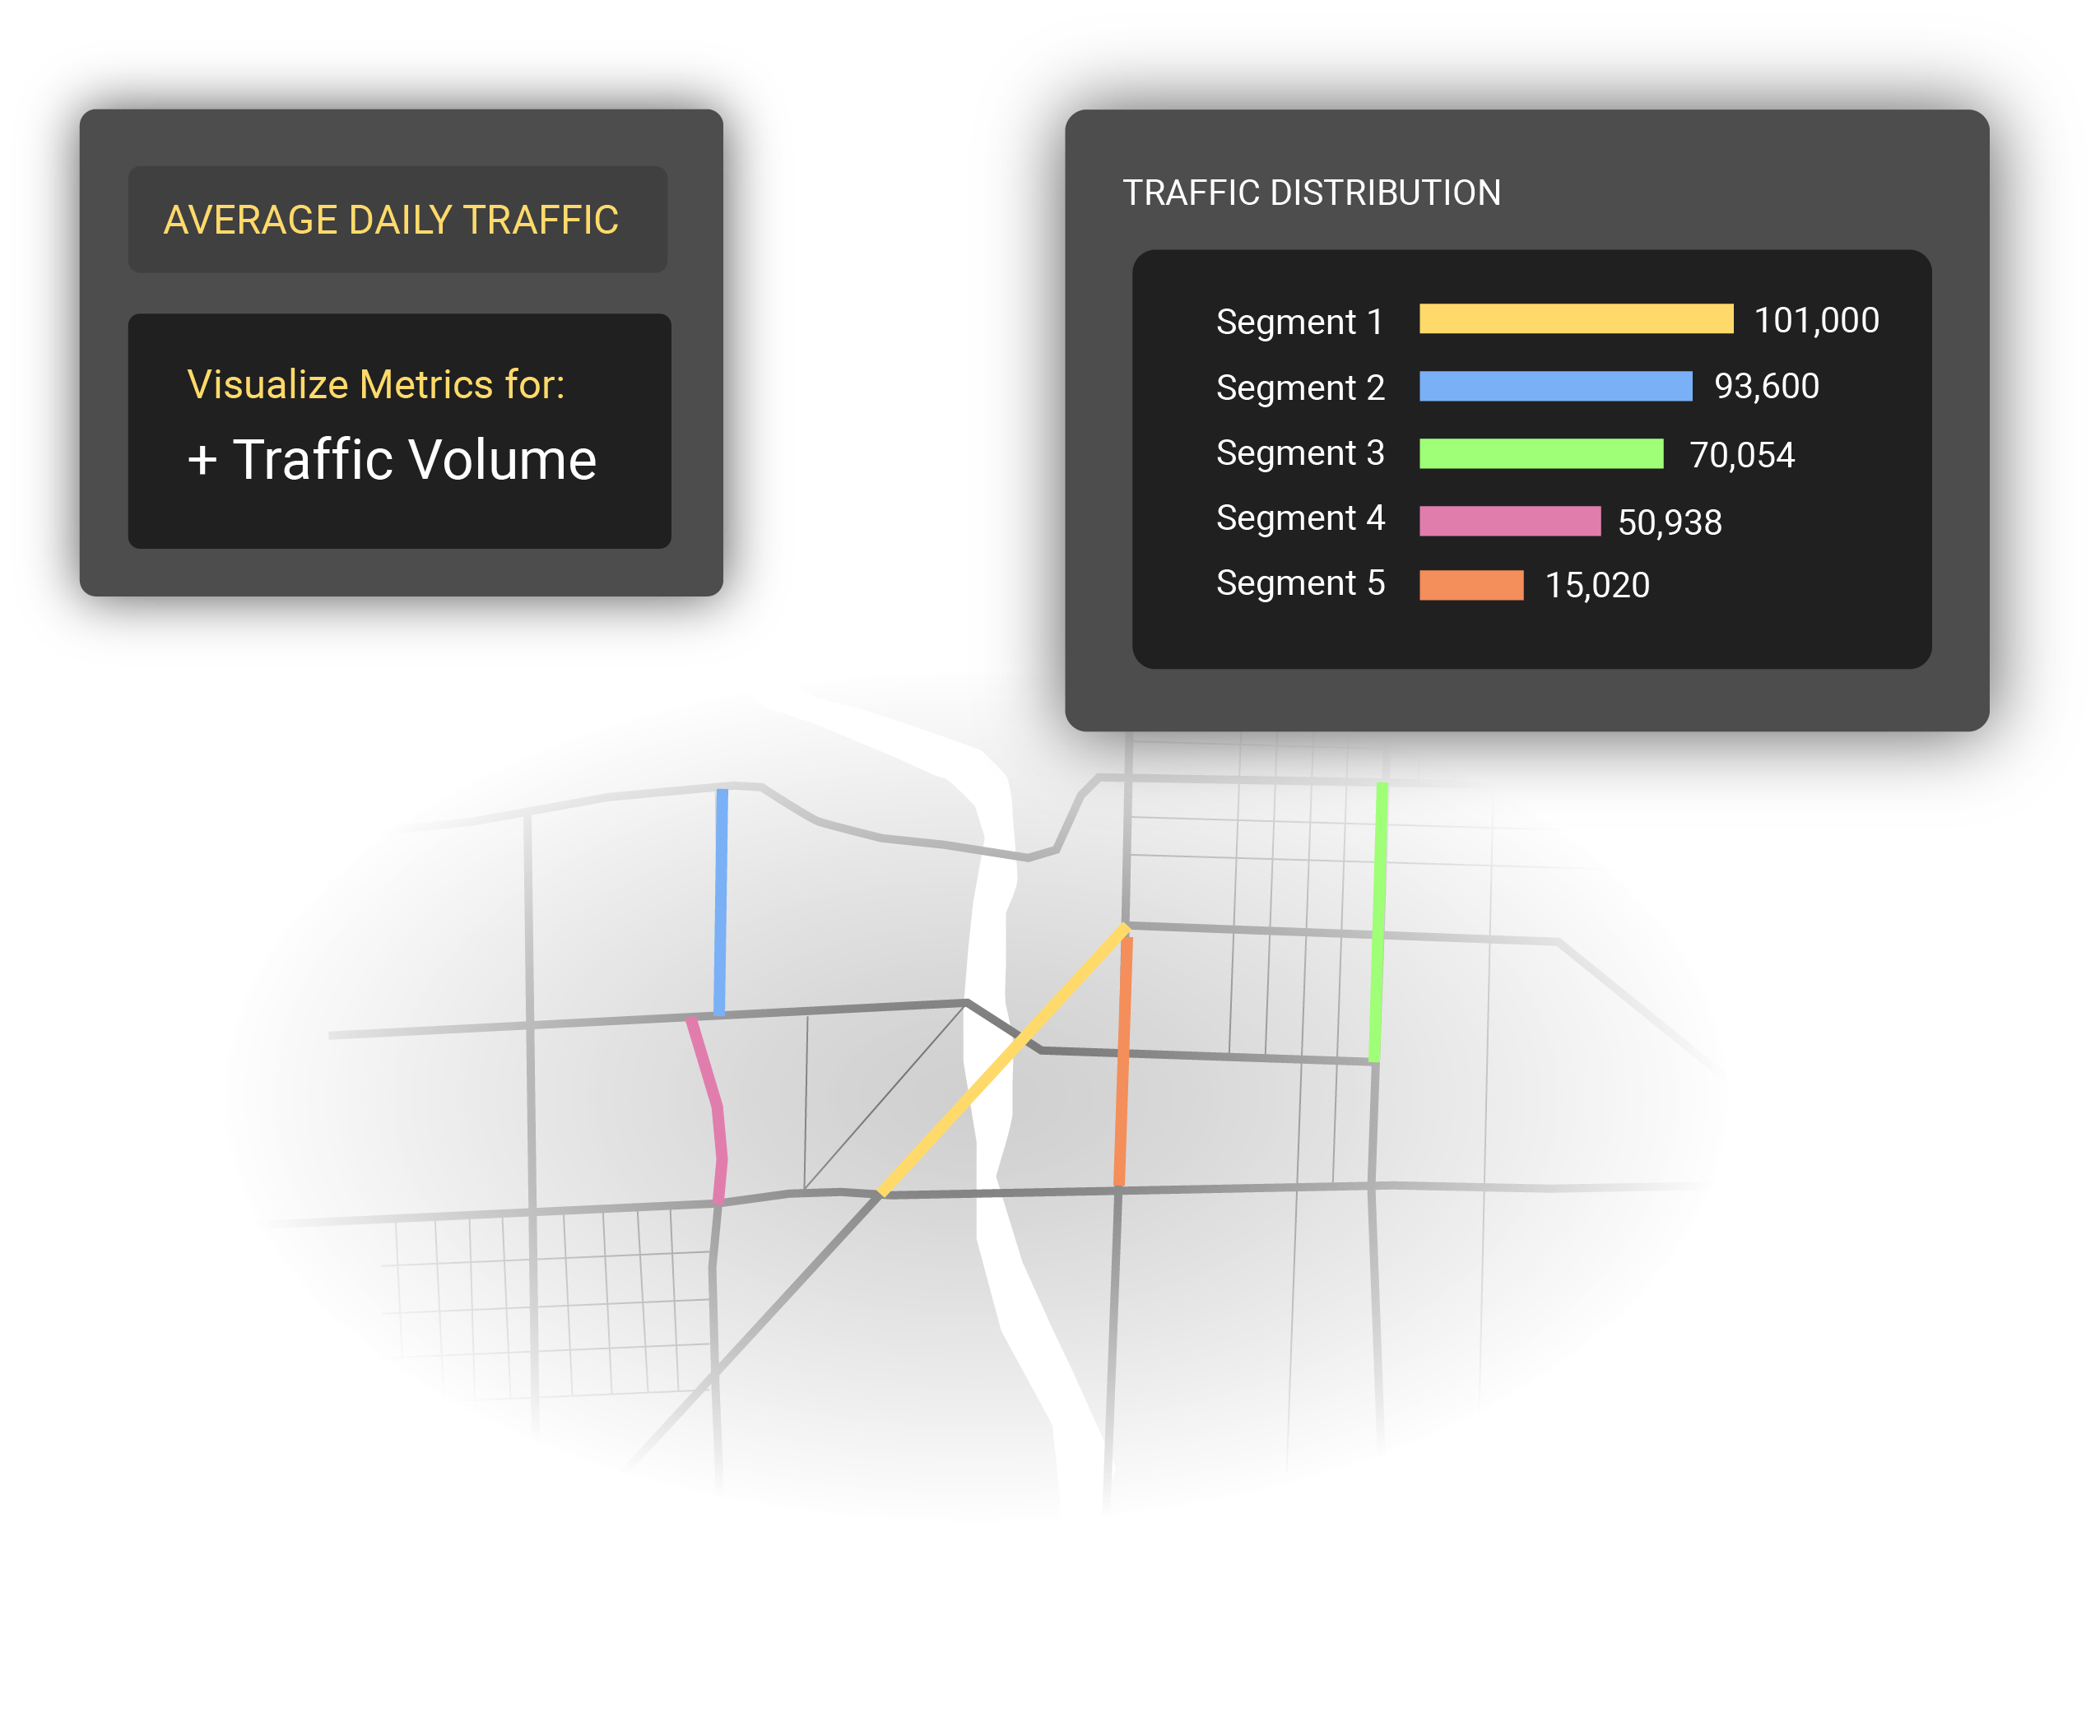
Access average daily traffic (ADT) counts for any road segment in the U.S. and Canada and take advantage of the following features:
- Interactive charts visualizing average daily traffic time trends
- Yearly, monthly, daily, and hourly traffic patterns
- 2019, 2020, and 2021 time periods

Join 1000s of your peers who use StreetLight InSight® to power more than 10,000 projects each month.
STATES
.png?width=430&height=576&name=New%20logo%20column%20(1).png)
CITIES & MPOs

CONSULTING FIRMS

ENTERPRISE


Essentials for everyday transportation studies, available on your desktop 24/7
StreetLight InSight® is a software analytics platform that describes how vehicles, bicycles, pedestrians, and transit passengers move on our streets. The platform allows users to run multiple analyses with a single subscription, ranging from AADT to routing to Origin-Destination to VMT to Equity Metrics, and much more. StreetLight InSight® Go offers the opportunity to explore some of the key Metrics, such as average daily traffic, and get a feel for our analytics platform before you purchase.
The transportation industry’s most comprehensive validated Metrics
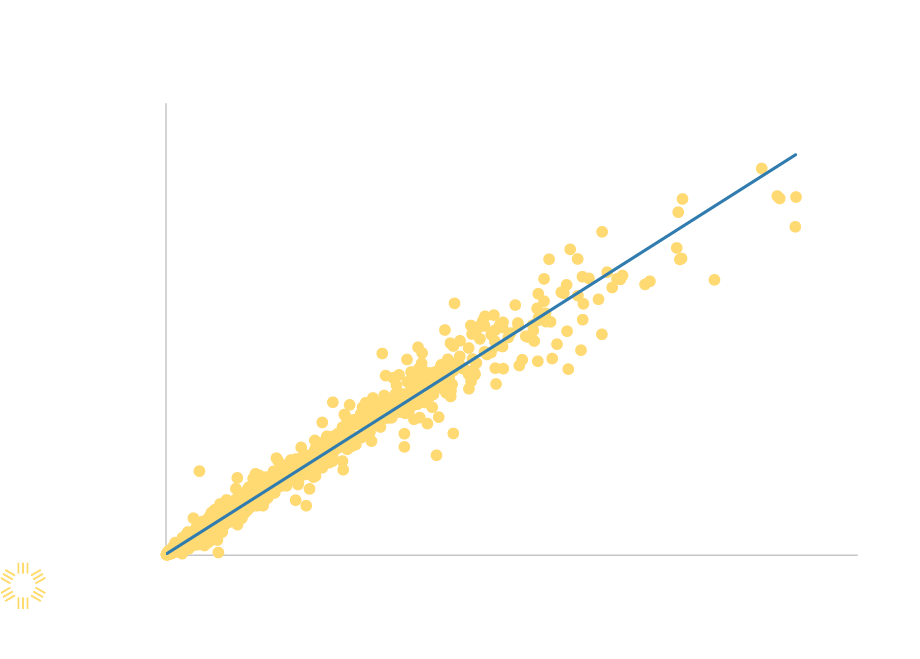
With projects in 48 U.S. states and all 10 Canadian provinces, our Metrics have been used and validated by hundreds of agencies and transportation firms. StreetLight’s Metrics have been validated against external public sources including permanent sensors, household surveys, license plates, bluetooth scanning, and the U.S. Census. Additional third-party validations with clients and partners using private data also support the quality of our Metrics.
How we generate the Metrics you need
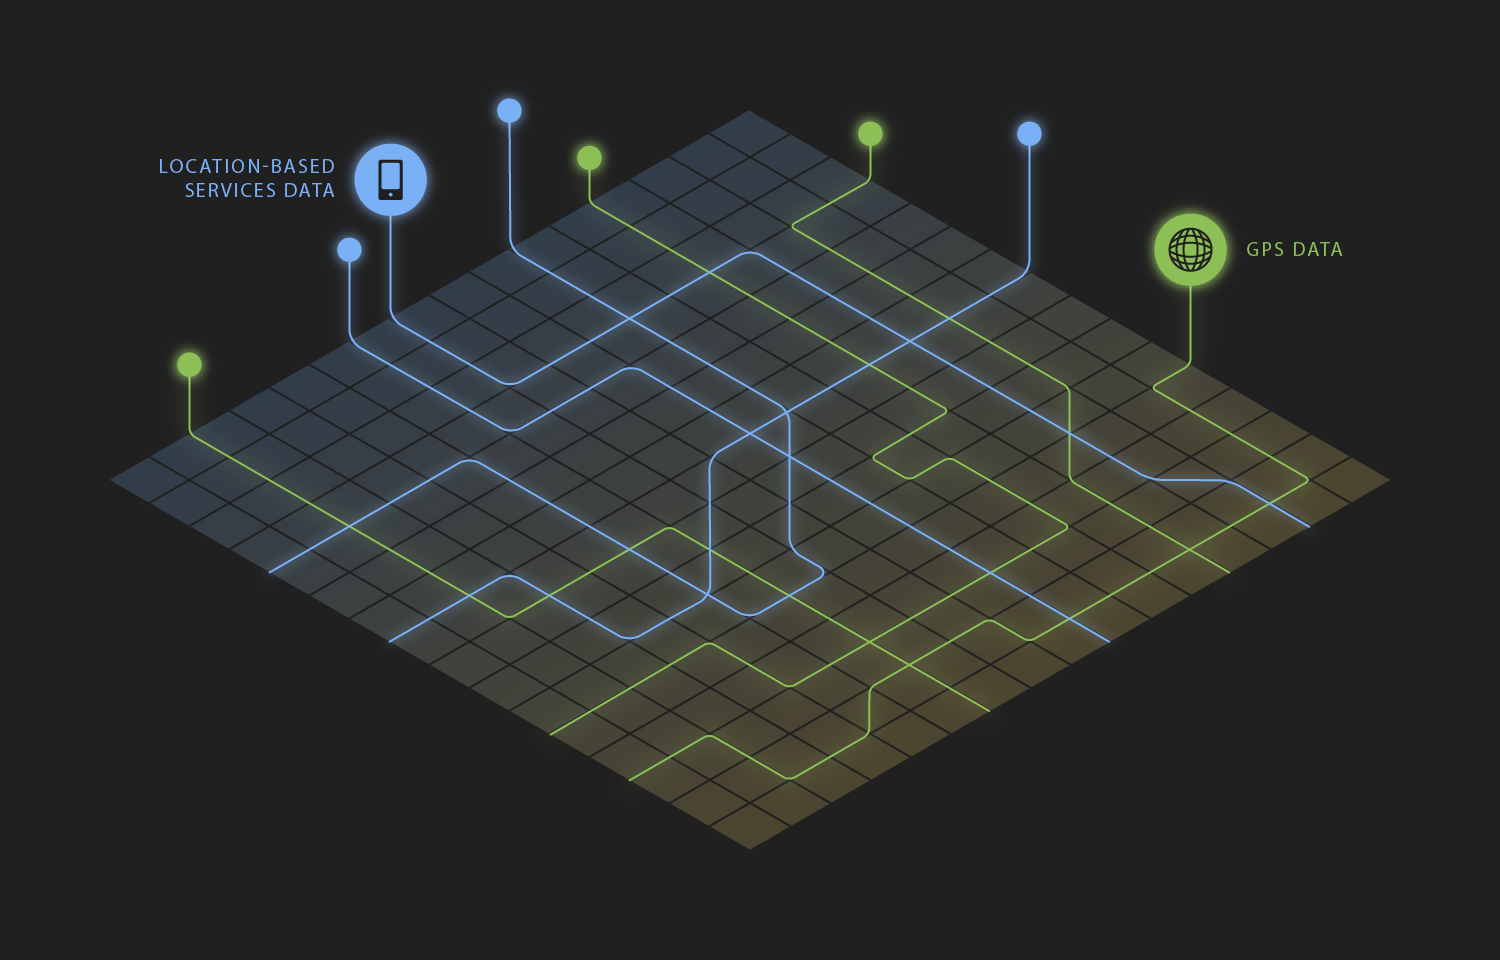
Every month, we ingest, process, and index more than 40 billion anonymized location records from smartphones and navigation devices in connected cars and trucks. Our proprietary data processing engine, Route Science®, algorithmically transforms the anonymized data into contextualized, normalized, and aggregated travel patterns.
You get access to the data output: analytics that describe traffic activity on our streets.