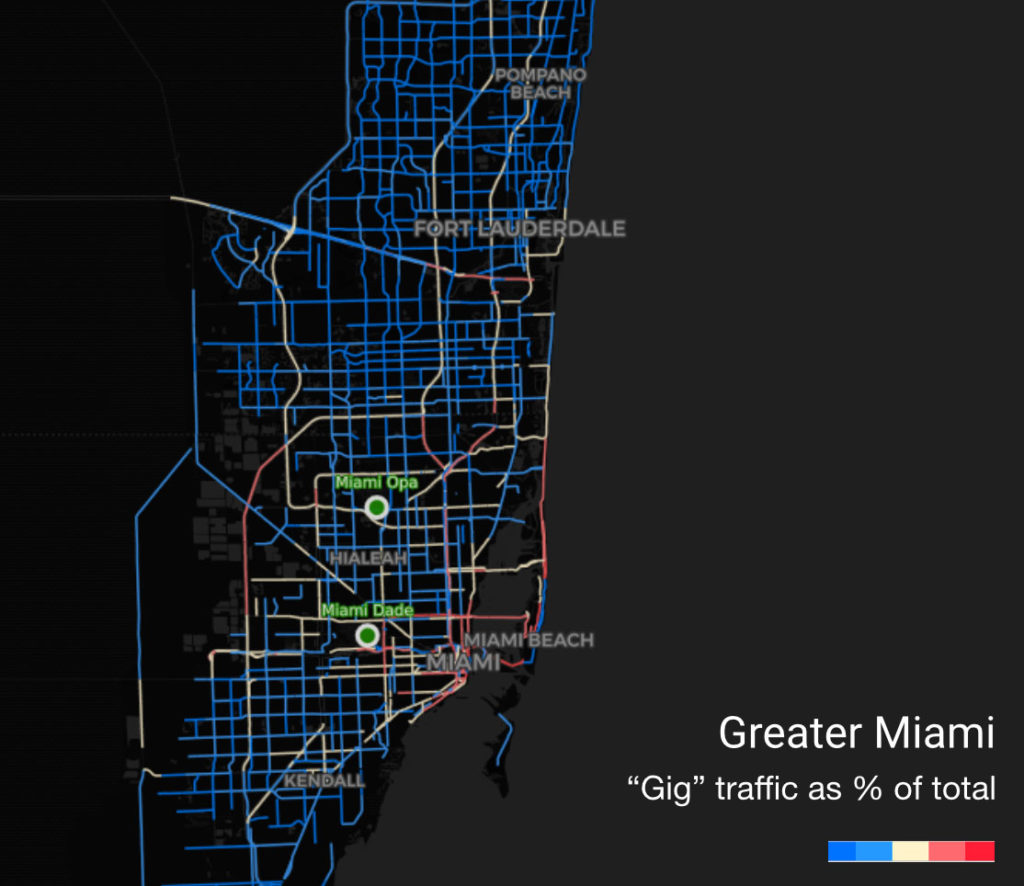
TNC DATA

Ride share and delivery data for 4.5 million miles of roadway

We process billions of location records every month to illuminate traffic patterns on North America’s roads — and let you zero in on: 

  • Personal vehicles vs. ride share traffic
  • Light delivery vehicle traffic
  • Commercial truck traffic
ride sharing

Our analytics enable 10,000+ transportation projects a month

test
new york city Department of transportation
arup
Toronto
arcadis
Fehr Peers
VHB
sandag
NVTA
SSTI
VDOT
Stantec

Ride sharing and delivery data

  • Understand how “gig” driving interacts with congestion in your city
  • Zero in on demographics and transit ridership
  • Get traffic penetration of “gig” vehicles on desired streets, days of week or times of day

Use empirical data to influence the public debate. Measure how “gig” driving interacts with social justice, safety, climate and VMT.

GET STARTED

How we get the data you need

Every month, we ingest, index and process over ~40 billion anonymized location records from smart phones and navigation devices in connected cars and trucks.  Our proprietary data processing engine, Route Science®, algorithmically transforms them into contextualized, normalized and aggregated travel patterns.

You get access to the output: analytics that describe how personal vehicles, “gig” vehicles, bicycles and pedestrians move on our streets.

GET STARTED

Contact us for the “gig” driving traffic data you need

*indicates a required field