TRANSPORTATION DATA
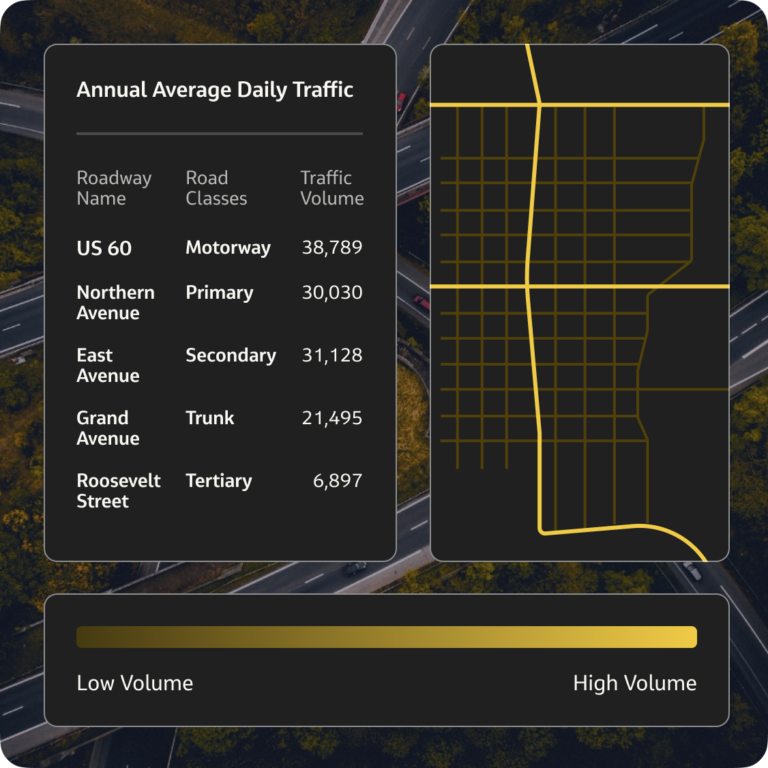
Get validated transportation data, right on your desktop
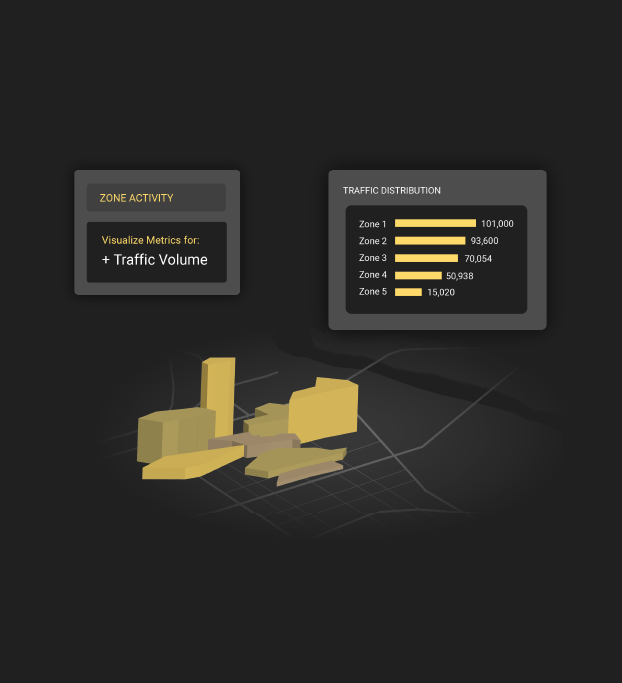
StreetLight’s transportation analytics platform offers traffic counts, bike activity, speed, and more, to understand both existing conditions and trends across time.
- Answer social equity, sustainability, and safety questions with historical insights
- Get up-to-date multimodal transportation data for all regions and roadways
- Tackle transportation demand management projects, infrastructure prioritization, Turning Movement Counts, corridor studies, and more with the click of a button
![Traffic Distribution](https://learn.streetlightdata.com/hubfs/SEM%20pages/long_traffic%20distribution.png)
Automate your transportation data collection processes
Redeploy your time and resources from data collection to managing transportation. Access instant transportation analytics for every rural, local, and urban roadway and standard or user-defined area, spanning 5 million miles of roadway and 10 million Census Blocks. Understand travel patterns for all modes, and get transportation data such as vehicle trip volume, travel speeds, routing, bicycle and pedestrian activity, demographics, and more.
Multimodal data for transportation demand management
Get granular up-to-date multimodal transportation analytics and harness StreetLight’s recurring comprehensive vehicle, truck, bicycle, bus, rail, and pedestrian data as inputs for your studies and projects. Tackle congestion and prioritize active transportation infrastructure by understanding travel behavior for all modes.
Augment travel surveys with Big Data to enhance transportation models
Get comprehensive travel patterns and behaviors instantly, and run repeated analyses for all modeling efforts instead of commissioning an analysis for each project. Using Location-Based Services (LBS) data, our transportation data set closely represents the population at large – more so than typical surveys.How we generate the Metrics you need
Every month we ingest, process, and index over ~40 billion anonymized location records from smartphones and navigation devices in connected cars and trucks. Our proprietary data processing engine, Route Science®, algorithmically transforms them into contextualized, normalized, and aggregated travel patterns.
You get access to the data output: analytics that describe how vehicles, bicycles, pedestrians, and transit passengers move on our streets.
Our traffic data enables 6,000+ transportation projects a month
![test](https://learn.streetlightdata.com/hubfs/Siemens%20logo.jpg)
![new york city Department of transportation](https://learn.streetlightdata.com/hubfs/new%20york%20city%20Department%20of%20transportation%20logo.jpg)
![arup](https://learn.streetlightdata.com/hubfs/arup%20logo.jpg)
![Toronto](https://learn.streetlightdata.com/hubfs/Toronto%20logo.jpg)
![arcadis](https://learn.streetlightdata.com/hubfs/arcadis%20logo.jpg)
![Fehr Peers](https://learn.streetlightdata.com/hubfs/Fehr%20Peers%20logo.jpg)
![VHB](https://learn.streetlightdata.com/hubfs/VHB%20logo.jpg)
![sandag](https://learn.streetlightdata.com/hubfs/sandag%20logo.jpg)
![NVTA](https://learn.streetlightdata.com/hubfs/NVTA%20logo.jpg)
![SSTI](https://learn.streetlightdata.com/hubfs/SSTI%20logo.jpg)
![VDOT](https://learn.streetlightdata.com/hubfs/VDOT%20logo.jpg)
![Stantec](https://learn.streetlightdata.com/hubfs/Stantec%20logo.jpg)